25 years · 50+ enterprises · London, UK

The business you're running
isn't the business you could be running.

We work inside your operations — auditing data, illuminating the processes you've stopped questioning, and rebuilding them into a profit engine. With dashboards that watch what you can't, and alerts that catch what you wouldn't.

Revenue Identified
$4.2M
+38% in 90 days
Leakage Recovered
$1.8M
Hidden ops cost
Process Latency
−62%
Avg. cycle time
Compliance Score
99.4%
SOC 2 + ISO 27001
The Engagement

We don't leave you with a report. We leave you with a system.

Every engagement follows the same transparent path: we discover what is broken, we engineer what fixes it, and we hand over something your team can run without us.

01 · THE OFFERING

Embedded Operational Intelligence

We embed inside your business for 2–4 weeks. We audit your processes, interrogate your data, and map the workflows that actually move your revenue — not the ones on the org chart.

  • On-site or remote team embedding
  • Process & data architecture audit
  • Quantified leakage & risk baseline
02 · THE END RESULT

A Business That Runs Itself

You stop firefighting. Your dashboards tell you what needs attention before it becomes a problem. Your processes run with measurable speed, accuracy, and compliance — without you chasing them.

  • Real-time operational visibility
  • Automated alerts for drift & leakage
  • Governance without bureaucracy
03 · THE DELIVERABLES

Tangible Assets You Own

You receive everything we build: live dashboards, data pipelines, alert systems, process documentation, and compliance controls. No black boxes. No vendor lock-in. Your IP, your infrastructure.

  • Live executive & ops dashboards
  • Data pipelines & semantic layer
  • Process maps, runbooks & compliance pack

Typical timeline: Discovery in 2–4 weeks. First dashboards live in 30 days. Full system operational in 90 days. Ongoing governance available monthly.

Our Founder solved complex business challenges for 50+ enterprises across banking, energy, insurance & technology during assignment
The Problem

Every business has a dark side — the part of the operation that's quietly costing you money while everyone is busy watching the front of the house.

  • 01
    Invisible process debt
    Manual handoffs, shadow spreadsheets, and "the way we've always done it" — accumulating friction that nobody owns and nobody measures.
  • 02
    Decisions made on gut, not data
    Your team is making pricing, hiring, and inventory calls based on intuition — not the signals already sitting in your own systems.
  • 03
    Profit leaking from a dozen small holes
    Churn you never prevented, scope creep you never billed for, and operational waste you don't know how to find — adding up to seven figures annually.
  • 04
    No system watching the system
    Without monitoring and compliance alerts, problems are discovered by the customer — not by you. By then, it's a refund, a churn, or a fine.
Dark data visualization
The Business Iceberg
What you see vs. what costs you
87%
of operational cost lives below the surface — invisible, unmonitored, and quietly compounding.
What We Do

Five disciplines, one operating system for your business.

We don't just consult. We sit inside your operations, instrument the processes that matter, and stay — watching the dashboards, adjusting the alerts, governing the standards.

/01
Process Auditing

We map every workflow, handoff, and decision point. We find the 20% of processes generating 80% of friction and cost.

/02
Data Engineering

Your data is already telling you what's wrong. We build the architecture, the pipelines, and the models to listen to it.

/03
Dashboard Design

Purpose-built dashboards for every layer of the business — executive, operational, and ground-level — with the right signal, no noise.

/04
Compliance & Security

SOC 2, ISO 27001, GDPR, HIPAA — built into the operating fabric. Continuous monitoring catches the drift before auditors do.

/05
Ongoing Monitoring

Dashboards that watch. Alerts that fire. We stay embedded — tuning, adjusting, and catching what nobody else would.

The Nexteck Method

A four-phase engagement that compounds.

Most consultants leave a deck. We leave an operating system — with dashboards, alerts, and a team that knows how to use it. Every phase is billable to outcomes, not hours.

01
Discover

We embed with your team for 2-4 weeks. Process maps, data audits, and a quantified baseline of where profit is going.

2-4 WEEKS
02
Illuminate

We surface what you couldn't see — the dark side, the ignored side, the revenue leaking from broken handoffs and missed signals.

REPORT + ROADMAP
03
Engineer

We build the dashboards, the data pipelines, the alerts, and the process controls. Shipped in 30, 60, 90-day increments.

30 / 60 / 90
04
Govern

We stay. Monitoring the system, tuning the alerts, and ensuring the business keeps running like the business it should be.

ONGOING
Enterprise Architecture Framework

Built on TOGAF ADM — the world's most trusted enterprise architecture process.

The Open Group Architecture Framework (TOGAF) and its Architecture Development Method (ADM) is the global standard for designing, planning, implementing, and governing enterprise information architecture. Developed over 25 years and adopted by 80% of Fortune 500 companies, ADM provides a proven, repeatable cycle for transforming business vision into operational reality.

ADM Cycle
TOGAF
9.2
Continuous
Improvement
A · Architecture Vision
Set the North Star

Define the business problem, scope, and stakeholder map. Establish the architectural principles that will guide every decision downstream.

B · Business Architecture
Map the Operating Model

Document organization structure, business functions, process flows, and information flows. This is where hidden friction surfaces.

C · Information Systems
Design Data & Applications

Define the data architecture, application portfolio, and integration patterns. Ensure information moves securely and accurately.

D · Technology Architecture
Select the Foundation

Choose the hardware, software, and network infrastructure. Build for resilience, scalability, and compliance from day one.

E · Opportunities & Solutions
Identify the Gaps

Conduct gap analysis between baseline and target architecture. Prioritize initiatives by business value, risk, and feasibility.

F · Migration Planning
Sequence the Transformation

Create the implementation and migration strategy. Define work packages, timelines, and transition architectures that de-risk delivery.

G · Implementation Governance
Ensure Compliance

Govern the implementation against the architecture. Conduct compliance reviews, enforce standards, and manage change requests.

H · Architecture Change Mgmt
Adapt & Evolve

Continuously monitor the business and technology environment. Update the architecture in response to new requirements and opportunities.

Req · Requirements Management
Central Command

Manage architectural requirements throughout the ADM cycle. Ensure traceability from business need to technical implementation.

Risk Reduction
Structured phases eliminate guesswork and prevent costly rework.
Faster Delivery
Reusable architecture assets accelerate every future project.
Stakeholder Alignment
Common language bridges the gap between business and IT.
Measurable ROI
Every phase is tied to business outcomes, not just technical outputs.
01 · Process Auditing

See every workflow. Question every handoff.

Every business runs on a thousand small processes that nobody has ever mapped. We start there. We embed with your team, document the workflows that move your revenue, and surface the handoffs, the manual steps, and the silent failures that are quietly costing you margin.

  • End-to-end process maps for every revenue-critical workflow
  • Friction analysis — cycle time, error rates, manual intervention points
  • Quantified baseline of operational cost, leakage, and risk exposure
  • Prioritized remediation roadmap with ROI per initiative
2-4 WEEKS ON-SITE
Process audit workflow
AUDITED WORKFLOW · ORDER-TO-CASH
Intake
Validate
Approve
Fulfill
Invoice
Report
Cycle time
14.2 days
Manual steps
17
Target
3.2 days
02 · Data Engineering

Your data is already telling you what's wrong. We build the system that listens.

Most enterprises sit on top of petabytes of data with no architecture to make sense of it. We design and build the pipelines, the warehouses, the models, and the semantic layer that turn your raw operational data into a single, trustworthy source of truth.

  • Cloud data warehouse architecture (Snowflake, BigQuery, Redshift, Databricks)
  • Real-time and batch ETL/ELT pipelines with observability
  • Semantic layer & data contracts — one definition for every metric
  • ML-ready feature stores for forecasting, anomaly detection, and propensity
SNOWFLAKE DBT AIRFLOW KAFKA
Data engineering pipelines
CRM ERP BILLING PRODUCT SUPPORT WAREHOUSE Snowflake raw · stage core · mart semantic 5.2 TB · 847 tables ▲ live DASHBOARDS ML MODELS ALERTS REPORTS APIs
03 · Dashboard Design

Dashboards built for decisions — not for analysts.

Most dashboards answer yesterday's questions. Ours are designed for tomorrow's moves. Every chart, every KPI, every alert is built around one role, one decision, and one moment in time. No clutter. No vanity metrics. No reports nobody reads.

  • Executive overview — 5 KPIs, 60-second decision framework
  • Operations control tower — live process health, queue depth, anomalies
  • Profit leakage radar — itemized, attributed, recoverable
  • Compliance posture — control coverage, drift, evidence collection
TABLEAU POWER BI LOOKER CUSTOM
Dashboard design
Executive · Q3
Revenue
$12.4M
▲ 23.4%
Margin
31.8%
▲ 4.2 pts
CLV
$48.2K
▲ 12.1%
04 · Compliance & Security

Built to pass the audit you haven't faced yet.

Compliance isn't a department — it's a property of the system. We engineer SOC 2, ISO 27001, GDPR, HIPAA, PCI-DSS and more directly into the data architecture, the access model, and the operational runbooks. Not bolted on. Not approximated. Engineered.

  • SOC 2 Type II, ISO 27001, GDPR, HIPAA, PCI-DSS readiness programs
  • End-to-end encryption (AES-256 at rest, TLS 1.3 in transit), customer-managed keys
  • RBAC, row-level security, SSO/SAML, SCIM provisioning
  • Immutable audit logs, evidence collection, automated control testing
SOC 2 ISO 27001 GDPR HIPAA
Compliance controls
SOC 2
Verified
ISO 27001
Verified
GDPR
Verified
HIPAA
Verified
PCI-DSS
In Progress
Encryption
AES-256
SSO
SAML / OIDC
Audit Log
7-yr Retention
NDA / DPA
Live
05 · Ongoing Monitoring

We don't hand over the keys. We stay and watch the system.

Most consultancies disappear after delivery. We don't. Nexteck stays embedded — tuning the dashboards, adjusting the alert thresholds, reviewing the metrics, and catching the new failure modes that emerge as the business evolves. The system is alive. The monitoring has to be too.

  • 24/7 dashboard monitoring with anomaly detection and threshold tuning
  • Tiered alerting (info / warn / critical) routed to the right team, in the right channel
  • Weekly metric reviews, monthly board-ready reporting, quarterly strategic reviews
  • Continuous improvement — new dashboards, new alerts, new opportunities surfaced
24/7 SLAs QUARTERLY REVIEWS
Operations monitoring
Live Operations Monitor
15:42:08 GMT
Churn spike · Enterprise tier −$84K
Scope creep · Project Halcyon $22K
Pipeline velocity · EMEA +18%
Inventory turnover · Q3 6.2×
Vendor SLA · DataCo 94.1%
Customer satisfaction +0.4 pts
Anomaly · Login pattern 3.2σ
Industries

Built for the sectors where complexity is the constant.

From trading floors to oil fields, we've operated inside the most demanding environments on earth. Every industry has its own rhythm, its own risks, and its own hidden margin.

01 Banking & Finance

Trading floors, risk books, and regulatory pressure.

We help banks and financial institutions see what their risk models miss. From real-time trading analytics to compliance dashboards that satisfy regulators before they ask.

  • Real-time risk exposure and P&L attribution
  • Regulatory reporting automation (Basel, MiFID, CCAR)
  • Fraud detection and anomaly monitoring
  • Customer 360 and lifetime value optimization
40%
Faster regulatory reporting
$1.2M
Avg leakage recovered
99.97%
Data accuracy score
Banking trading floor
Portfolio Exposure
$4.2B
▲ 2.3% vs benchmark
AAPLApple Inc.$184.32+1.2%
MSFTMicrosoft$378.91+0.8%
TSLATesla Inc.$242.15−1.4%
NVDANVIDIA$465.20+2.1%
02 Energy & Resources

From wellhead to balance sheet — every barrel accounted for.

Energy majors operate at a scale where a 1% efficiency gain is worth hundreds of millions. We build the operational dashboards that connect field data to boardroom decisions.

  • Production optimization and downtime prediction
  • Supply chain and logistics visibility
  • Environmental compliance and carbon reporting
  • Capital project tracking and cost control
12%
Uptime improvement
$8M
Inventory optimization
3.2M
Tons CO₂ tracked
Energy operations
Daily Production
2.4M bbl
▲ 3.2% vs target
Uptime
97.4%
▲ 1.8 pts
Maintenance
14 units
▼ 2 overdue
Carbon Intensity
12.4 kg
▲ 0.3 kg/bbl
Logistics
94.1%
On-time delivery
03 Insurance

Claims that move faster. Risk priced sharper.

Insurance runs on data latency. The faster you can assess risk, price a policy, or settle a claim, the more margin you keep. We eliminate the friction in every step.

  • Claims automation and fraud detection
  • Actuarial data pipelines and risk modeling
  • Policy lifecycle monitoring and renewals
  • Regulatory capital adequacy reporting
68%
Faster claims settlement
$3.4M
Fraud prevented
94%
Renewal accuracy
Insurance operations
Claim Filed
#CLM-2026-0892
09:14
Document Verified
AI + human review
09:42
Adjuster Assessment
Auto-routed · Priority
10:05
Approval & Payout
Pending
04 Healthcare

Patient flow, operational flow, cash flow.

Healthcare organizations drown in data but starve for insight. We connect clinical operations, revenue cycle, and compliance into a single operational view.

  • Patient flow optimization and capacity planning
  • Revenue cycle management and denial prevention
  • HIPAA-compliant data architecture
  • Quality metrics and outcome tracking
34%
Shorter patient wait times
$2.1M
Revenue cycle recovery
100%
HIPAA compliance score
Healthcare operations
ICU Occupancy
82%
14 beds available
ER Wait Time
24 min
Target: 15 min
Surgery Schedule
94%
On-time starts
Claims Denied
3.2%
▼ 1.8 pts vs last mo
05 SaaS & Technology

Growth at scale without operational chaos.

SaaS companies move fast and break things — until the broken things start costing you customers. We instrument the full customer lifecycle from trial to expansion.

  • Product analytics and feature adoption tracking
  • Churn prediction and expansion revenue signals
  • Sales funnel velocity and CAC optimization
  • Infrastructure cost monitoring and FinOps
28%
Churn reduction
$1.8M
Expansion revenue found
14×
ROI in first year
SaaS metrics
Monthly Recurring Revenue▲ 12.4%
Net Revenue Retention▲ 4.2 pts
CAC
$1,240
LTV:CAC
4.8×
06 Retail

Every shelf, every channel, every margin point.

Retail is a game of inches. We help you see inventory turns, channel profitability, and customer behavior in real time — so you can move before the markdown.

  • Omnichannel inventory optimization
  • Dynamic pricing and promotion analytics
  • Customer segmentation and CLV modeling
  • Supply chain resilience and demand forecasting
18%
Inventory turn improvement
$4.2M
Markdown reduction
3.4×
Omnichannel ROI
Retail operations
$2.4M
Today's Revenue
1,842
Transactions
4.2%
Conversion
Top Performing SKUs
Premium Leather Jacket$84K
Wireless Earbuds Pro$62K
Smart Watch Series 8$51K
Running Shoes Elite$48K
The Output

Dashboards built for decision-makers, not analysts.

Every dashboard we build is purpose-designed for one role and one decision. No clutter, no vanity metrics, no reports nobody reads.

app.nexteck.io / executive / Q3-overview
Net Revenue
$12.4M
▲ 23.4% vs last quarter
Operating Margin
31.8%
▲ 4.2 pts
Customer Lifetime Value
$48,200
▲ 12.1%
Process Cycle Time
3.2d
▼ 62% from baseline
Revenue vs. Identified Opportunity Last 12 months
Realized revenue Identified opportunity
Top Alerts Live
Churn spike · Enterprise tier
Detected 12 min ago
−$84K
Scope creep · Project Halcyon
14h over baseline
$22K
Upsell opportunity · Acme Corp
Usage at 89%
+$48K
Pipeline velocity · EMEA
+18% week-over-week
$310K
Profit Leakage Detection

The money you're losing, itemized.

In every audit, we find profit leakage that wasn't visible from the corner office. Here's what a typical mid-market engagement surfaces in the first 60 days.

Unbilled scope creep
12 active projects, 8 over baseline hours
−$340K
Preventable churn
47 accounts flagged, 32 not contacted
−$1.2M
Idle inventory carrying cost
$890K in slow-moving SKUs
−$180K
Pricing under-optimization
14% margin left on table across 6 SKUs
−$520K
Manual reconciliation labor
1,840 hrs/yr at $85/hr loaded
−$156K
Total Annual Leakage Identified
$2,396,000
Financial data analysis
Case Study · Halcyon Logistics
Identified $2.4M in 47 days. Recovered 78% within 6 months.
Security & Compliance

Built to pass the audit you haven't faced yet.

Every dashboard, every data pipeline, every alert system is engineered against enterprise security standards from day one. You don't bolt compliance on later — it's the foundation.

  • SOC 2 Type II Certified
    Annual audits. Continuous controls monitoring. Ready for enterprise procurement on day one.
    VERIFIED
  • End-to-End Encryption
    AES-256 at rest, TLS 1.3 in transit. Customer-managed keys available on enterprise tier.
    AES-256
  • GDPR & HIPAA Ready
    Data residency in EU, US, APAC. Right-to-erasure workflows. PHI segregation for healthcare clients.
    EU/US
  • 24/7 Anomaly Monitoring
    ML-driven anomaly detection flags unusual access patterns, data exports, and configuration drift in real time.
    LIVE
  • Immutable Audit Logs
    Every dashboard view, every config change, every alert — logged, signed, and retained for 7 years.
    7-YR
  • SSO, SCIM & RBAC
    SAML/OIDC, automated provisioning, role-based access down to row-level data permissions.
    ENTERPRISE
Secure operations center
Threat Surface
CLEAN
Last Audit
12 days ago
0 findings · 0 exceptions
The Architect

Built on a quarter-century of solving what others call unsolvable.

Founder · Principal Architect
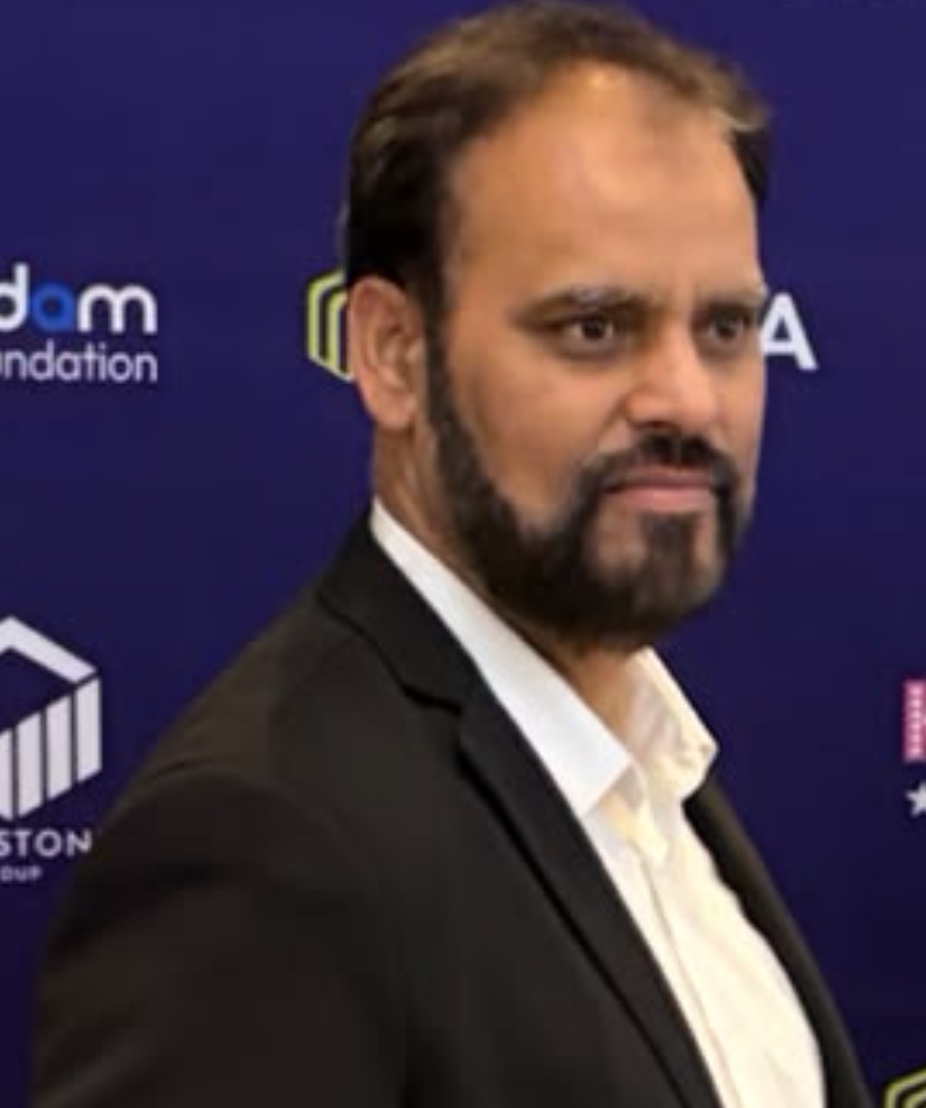
Nasar Faridi
Based in London, UK
Experience 25 Years
As Architect 15 Years
Engagements 50+ Enterprises

From trading floors in New York to oil fields in Doha — 25 years of building systems that actually move the needle.

Nexteck is the operating expression of a career spent inside the most demanding enterprise environments on earth. Nasar Faridi has spent 25 years — 15 of them operating at the architect level — designing, rebuilding, and rescuing the systems that run global banks, energy majors, insurance carriers, and high-growth technology firms.

His work has touched the operational core of Bank of America, Citi, Wells Fargo, and Freddie Mac; sovereign and commercial banking in the Middle East through Gulf International Bank, Saudi Aramco, QatarEnergy / Qatar Gas, and Ma'aden Group; UK financial services with Virgin Money and Zurich Insurance; and a portfolio of high-growth technology firms including Sofinish Technologies, Metaenterprices, EB4U, and Hyst — among more than 50 enterprise engagements.

The pattern across every engagement is the same: the business was sitting on a process, a dataset, or a decision that nobody had the time, the authority, or the vantage point to question. Nexteck exists to be that vantage point.

Credentials & Certifications
MSc Computer Science
Microsoft Certified Professional
Microsoft Certified Solution Design Professional
Microsoft Certified Azure Solution Architect Expert
Microsoft Certified Axapta Technical
Microsoft Certified Axapta Finance
Microsoft Certified Logistics
Microsoft Certified BizTalk Professional
TOGAF 9.0 Part 1 Certified — Enterprise Architecture
25
Years in Enterprise
15
Years as Architect
50+
Enterprise Clients
14
Industries Served
Selected Engagements
Bank of America
Citi
Wells Fargo
Freddie Mac
Gulf International Bank
Virgin Money UK
Zurich Insurance UK
Saudi Aramco
QatarEnergy / Qatar Gas
Ma'aden Group
Sofinish Tech UK
Metaenterprices UK
EB4U UK
Hyst UK
The Outcome

You don't just run the business.
You become the leader of it.

When the dashboards watch what you can't, when the alerts fire before customers complain, when the process runs without you chasing it — that's when a business operator becomes a business leader. That's the Nexteck difference.

$2.4M
Average annual leakage identified in first 60 days
62%
Reduction in process cycle time across engagements
14×
Average ROI in the first 12 months of partnership
Start the Conversation

See the business you haven't been seeing.

Book a 30-minute discovery call. We'll spend it listening — to your operation, your numbers, and the questions you haven't been able to answer yet.

Five capabilities. One operating system.
Jump directly to any capability, or scroll up to read each in depth.